From Power BI Model to Fully Automated Financial Reporting in Microsoft Fabric
One financial model. One source of truth. A reporting flow that can run from source data to refreshed management dashboards without repeated manual preparation.
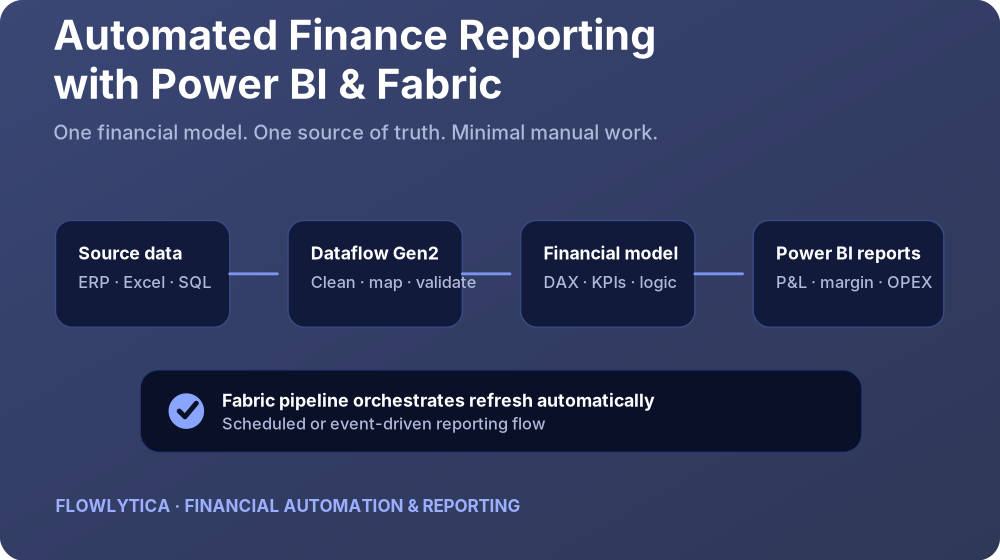
From manual reporting to a connected finance data platform
For many finance teams, building a dashboard is not the difficult part. The real effort happens before the dashboard is ready: exporting ERP data, cleaning files, maintaining mapping tables, combining actuals with budget and forecast, checking calculations and refreshing multiple reports.
A well-designed Microsoft Fabric and Power BI solution connects these separate steps into one repeatable process. Instead of treating every report as a separate file, I build a master financial model that becomes the central reporting layer for the finance function.
1. Building a master financial model in Power BI
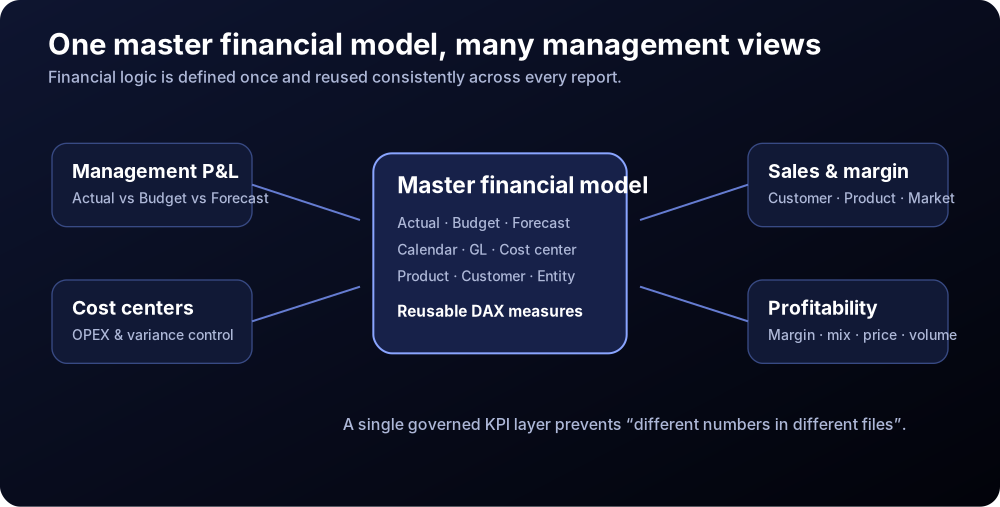
The foundation is a reusable Power BI semantic model designed specifically for financial reporting. Instead of rebuilding logic for every report, the model centralizes structures, mappings and calculations once.
- Actual financial results
- Budget, business plan and rolling forecast
- General ledger and cost center structures
- Customer, product and sales dimensions
- Revenue, COGS and OPEX classifications
- Management reporting hierarchies
- Calendar and comparison periods
DAX measures are then reused across reports for Actual vs Budget, Actual vs Forecast, YTD, year-on-year development, gross margin, contribution margin, profitability and other management KPIs.
2. Fabric Dataflow Gen2 as the preparation layer
Microsoft Fabric Dataflow Gen2 provides a managed cloud Power Query layer for recurring data preparation. Finance transformations can be defined once and applied every time new source data arrives.
- Clean and standardize account codes
- Map GL accounts into reporting hierarchies
- Standardize cost centers and organizational units
- Merge actual, budget and forecast datasets
- Correct data types and date structures
- Remove duplicates and validate source records
- Create reusable dimensions and business rules
The prepared data can then be loaded into a Fabric Lakehouse or Warehouse and reused by the Power BI model.
3. Automating the entire reporting process
Fabric Data Factory pipelines can orchestrate the workflow from ingestion through transformation to semantic-model refresh. That moves the solution beyond “a dashboard” and turns it into a reporting system.
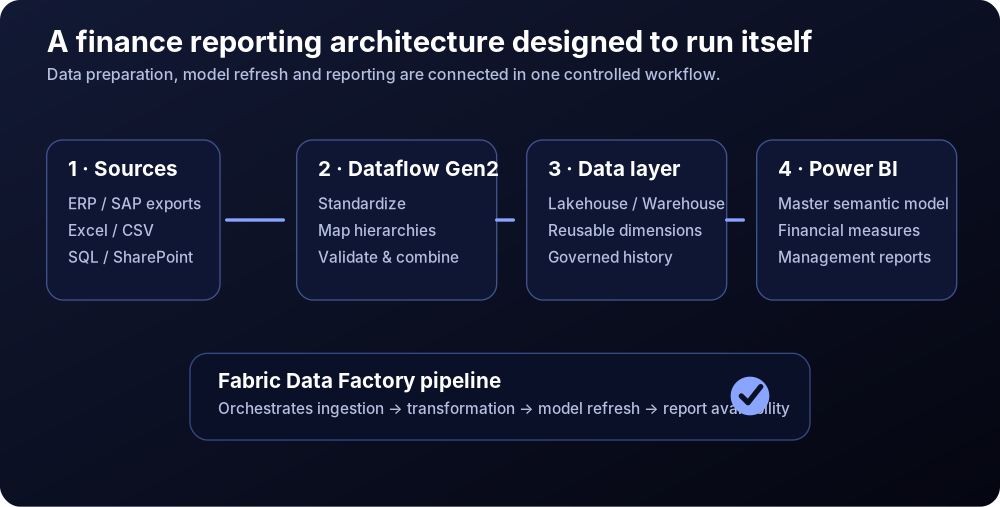
- Ingest new source data
- Run Dataflow Gen2 transformations
- Load validated data into the central data layer
- Refresh the Power BI semantic model
- Update reports connected to that model
- Monitor the process and identify failed refreshes
The workflow can run on a schedule or be triggered when new data becomes available. The monthly reporting process no longer needs to begin with opening a folder and refreshing ten separate files.
4. One model can power multiple management reports
Management P&L
Revenue, COGS, gross margin, OPEX, EBITDA and drill-down by company, business unit or cost center.
Sales & margin
Revenue, quantity, average selling price and profitability by customer, product, market or channel.
Budget vs actual
Performance against business plan and latest forecast using the same KPI definitions.
Profitability
Customer, product or segment profitability from a consistent financial model.
5. Why this matters for finance teams
The biggest benefit is not a better-looking dashboard. The value is a controlled and repeatable reporting process.
- Reduce repetitive manual Excel work
- Create one source of truth for financial KPIs
- Standardize reporting logic across the company
- Improve traceability of calculations and transformations
- Reduce dependence on manually maintained files
- Scale reporting as the business grows
- Give controllers more time for analysis instead of report preparation
How Flowlytica can help
Flowlytica builds reporting solutions from the perspective of a controller, not only from the perspective of a BI developer. The engagement can cover financial data structure, semantic modeling, DAX, Power BI dashboards, Dataflow Gen2, Fabric Lakehouse or Warehouse, Data Factory pipelines, refresh orchestration, validation controls, documentation and handover.